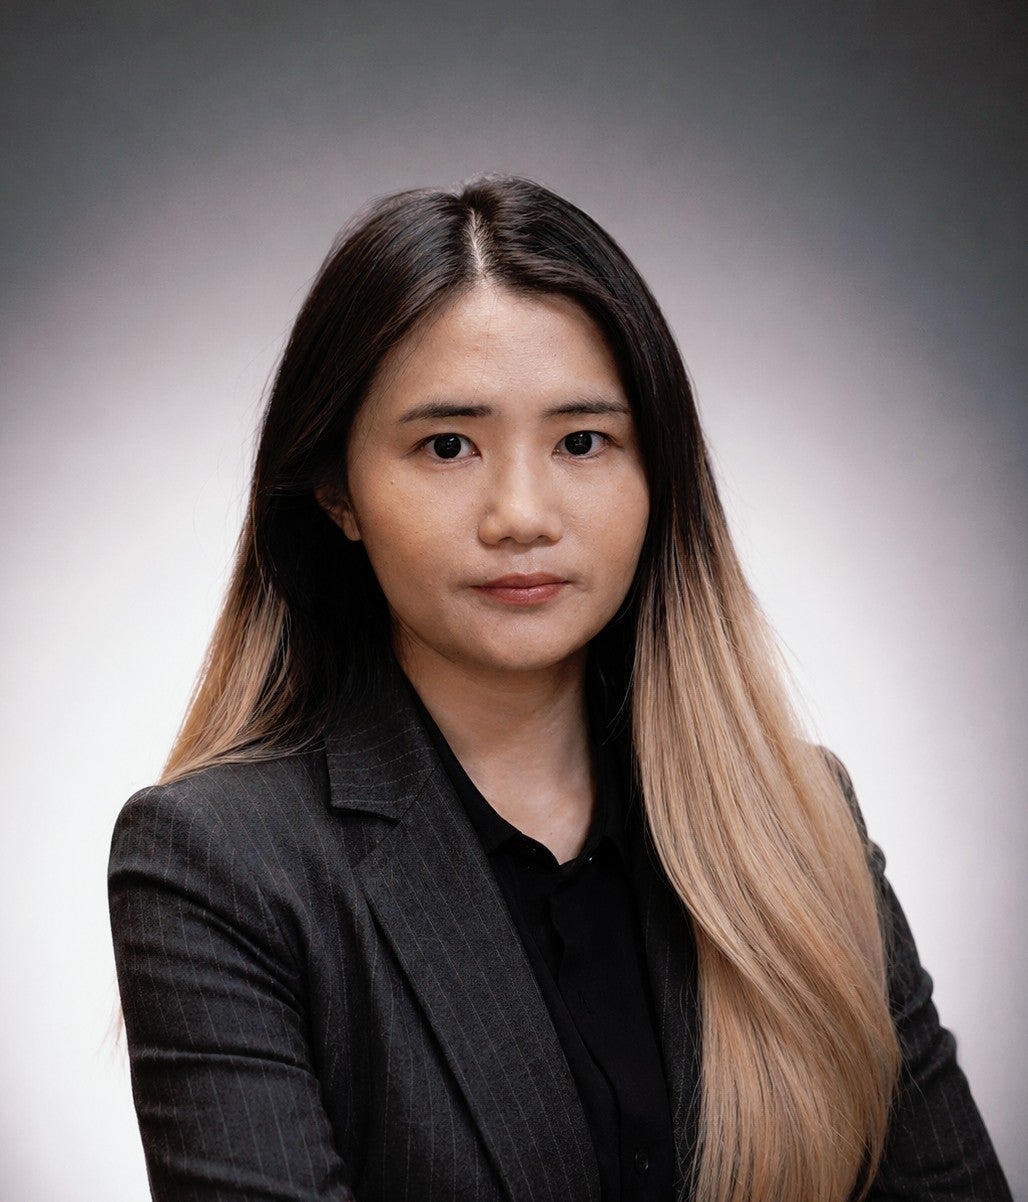
 Sui Ping Suen didn't arrive at Rensselaer Polytechnic Institute with a grand plan. She arrived looking for something simpler and, in many ways, more important: a place where she wouldn't get lost.
Small class sizes. Professors you could actually talk to. A campus where asking questions felt safe. That's what drew her to the Lally School of Management, and it's what she found there.
What she didn't expect was that the skills she'd quietly absorb in those classrooms, a Visual Basic assignment here, a group project with a local business there, would one day help doctors make better decisions for cancer patients. But that's the thing about education. Sometimes you don't know what you're learning until years later, when the right problem finally shows up.
Building Something Real
Suen dual-majored in business and mathematics at RPI, drawn to the way Lally wove technology and analytics into its curriculum. "Lally is a business school," she said, "but it also focused on technology." It wasn't just theory. It was about connecting ideas to tools, and tools to real decisions.
After graduating, she went on to Columbia University for a master's in Applied Analytics. Then came the job search, wide open and uncertain. She applied broadly for entry-level analyst roles, not knowing exactly where she'd land. Healthcare wasn't a destination she'd planned for. It was more like a door that opened, and she walked through it.
She's never looked back.
Today, Suen works as a senior clinical informatics analyst, sitting at the crossroads of data, technology, and patient care. She doesn't treat patients herself. But when a physician needs to understand whether a patient might need extra support at home, or whether a clinical study has enough participants to stay open, her work is the thing that makes that clarity possible.
"I don't directly see the patients," she said, "but I am helping physicians to make clinical decisions."
That distinction, indirect but deeply meaningful, has become the heartbeat of her career.
When the Data Is a Mess
Her first healthcare role was with NYC Health + Hospitals, where she helped operating room teams understand how their time was being used. The raw data existed. The insights didn't, not yet. Suen pulled the numbers, built dashboards, and helped clinical teams see things they hadn't been able to see before: were they using their OR time efficiently? Could they fit in more cases?
It was a practical, grounded lesson in what good analytics actually looks like. Not impressive charts for their own sake, but information designed around the people who need it.
Her next challenge was messier. In a cancer research office, she found that critical information was scattered across Excel files, Word documents, PDFs, and separate folders. Every time someone needed a report, they had to rebuild it from scratch. It was exhausting and error-prone and, more importantly, it was getting in the way of the work that actually mattered.
Suen recognized that a better report wasn't the answer. The team needed a system.
So she built one: a centralized SQL database, a suite of Tableau dashboards, a shared language for the data. Suddenly, leaders could answer questions that had once taken hours to dig out: How many studies are currently open? How many patients are enrolled? Do we have the capacity to take on another study? Is there a study that's been running for years with barely any participants, and should it be closed?
And then, in one of those small moments that make the work feel real, an old RPI memory surfaced. A Management Information Systems class had introduced her to Microsoft Access. She'd barely thought about it since. But now, building a data entry interface for the research office, that knowledge came back exactly when she needed it.
"At the time, I did not think about it," she laughed. "But it came back."
The Human Being Behind the Data Point
In oncology, data isn't abstract. Every row in a database represents a person navigating one of the hardest experiences of their life.
One of Suen's current projects involves geriatric oncology assessments, a structured set of questions designed to understand not just a patient's disease, but their whole situation. Can they get to appointments? Do they have someone at home to help them? Are they strong enough to tolerate aggressive treatment, or would a modified approach serve them better?
Before this kind of data was organized and accessible, clinicians had to dig through individual charts just to piece together a picture. Now, with centralized dashboards, care teams can see it all at once: how many patients qualified for an assessment, how many received one, how many were connected to follow-up services.
Suen described a moment that stayed with her, a case where the tool helped identify a patient who needed a home care referral they might otherwise have missed.
"If my data can help them identify more patients who need help," she said, "that is bringing patients a better experience and possibly a better outcome."
That's the work, right there.
Speaking the Same Language
One of the things Suen has learned, sometimes the hard way, is that good data means nothing if people aren't using the same definitions.
In the cancer research office, "closed" could mean at least three different things depending on who you asked: closed to new patients, closed to follow-up, or closed from a regulatory standpoint. "Patient enrollment" could refer to the date someone signed a consent form or the date they actually entered a study. These aren't small discrepancies. They can completely change what the numbers show.
Her answer was the same as always: build structure. Standardize the definitions. Create a data dictionary. Make it so that when two people look at the same number, they're actually talking about the same thing.
When she presents findings to clinical teams or hospital leaders, she doesn't lead with technical infrastructure. She leads with the question they're actually trying to answer. "We're looking at this time period, these locations," she might say. "Here's the number of new patients. Here's how many received the assessment. Here's the gap."
Clear. Human. Useful.
The People Who Told Her She Could
No one builds a career like this alone.
At RPI, an undergraduate program director named Peggy was a steady, supportive presence, someone who stayed connected with Suen long after graduation and eventually helped bring her back to campus as a guest lecturer.
Her first supervisor at NYC Health + Hospitals played a different kind of role. When Suen arrived, she knew basic SQL and Tableau and almost nothing about healthcare. Her supervisor gave her the runway she needed: time to learn, feedback on her dashboards, and maybe most importantly, a stubborn confidence in her ability to figure things out.
"Sometimes I felt like his requirement was hard to do," she remembered. "But he was like, no, Rebecca can do it. So I would do it."
That kind of belief is contagious. It has a way of becoming your own.
In her current role, she's found similar support in physicians who answer her questions, leaders who champion her work, and a quarterly mentor from a hospital program who helps her think through decisions and keep growing.
The advice that has stuck with her most is almost embarrassingly simple: just try. When an opportunity comes along and you're not sure you're ready, try anyway. Even if it doesn't work out, you'll learn something. You'll see where the gaps are. You'll know what to do next.
"You have nothing to lose," she said.
Getting Comfortable in Your Own Voice
Suen grew up speaking English as a second language, and early in her career, presentations required careful preparation. She would write everything out in advance. Public speaking didn't come naturally.
What changed it, over time, was the work itself. Building dashboards that people actually used. Explaining findings to clinical teams and watching something click. Getting positive feedback not because she'd performed well, but because she'd genuinely helped someone.
Confidence doesn't come from feeling ready. It comes from doing the thing and surviving it, and eventually from realizing you did more than survive.
Now, she tells students that communication is just as central to the analyst's role as any technical skill. SQL, Python, Tableau, Power BI, those are all worth learning. But they're only useful if you can listen first, understand what someone is actually trying to solve, and then explain what you found in plain language.
"You need to listen first," she said. Not just to gather information, but to understand the world the person you're helping actually lives in.
What She'd Tell Her Younger Self
If Suen could go back to her first day at RPI, she'd tell herself to wander a little more. Take classes outside your immediate path. Later, at Columbia, she discovered an interest in criminology data analysis and realized there had been a criminal psychology class at RPI she'd never known about as a student.
She'd also tell herself to be less transactional about networking. As a student, she sometimes skipped events if they didn't seem directly connected to a job. Now she sees those conversations differently.
"It is always not a bad idea to talk to people," she said. "Maybe just ask about their journey. Maybe you will learn from that."
Her own openness, to a field she hadn't planned for, to roles she wasn't sure she was ready for, is what brought her to work she genuinely loves.
What Comes Next
Looking ahead, Suen is focused on building out standardized data infrastructure for oncology, the kind of clean, structured foundation that makes everything else possible, including AI.
She's realistic about artificial intelligence in healthcare. The promise is real, particularly in turning unstructured clinical notes and pathology reports into usable data. But the foundation has to come first. You can't train a model on scattered spreadsheets and fragmented folders.
"First of all, we need to have the data," she said. "We need to put the data in the central place, then AI can read it."
Without that, the outcome is straightforward: garbage in, garbage out.
Her goals are personal, too. She wants to keep doing work that helps clinicians help more patients. And she wants to be part of changing what healthcare leadership looks like, with more women at the table, shaping strategy and systems and decisions that affect people's lives.
Her definition of success has shifted since her student days. Back then, it meant grades, graduate school, a job offer. Now it means something harder to measure but easier to feel: having real choices, and doing work that actually matters.
A Story Still Being Written
Suen's path from RPI to healthcare analytics wasn't a straight line. It was a series of open doors, willing mentors, and problems worth solving.
She came to RPI wanting to be known and supported. She left with analytical skills, a feel for strategy, and the confidence to keep learning through uncertainty. Along the way, the people around her pushed her further than she thought she could go, and the patients behind the data gave her a reason to keep going.
Her advice to students is simple: stay curious, talk to people, and don't stop at the surface of things.
When you're looking at data, she says, ask what each row actually means. Look for the trend. Then ask why the trend is happening. Consider what might be causing it. Go deeper.
That instinct has guided everything she's built, and it's still guiding her today.
Author: Lynda Holt, holtl3@rpi.edu